2021년 10월30일 Bitcoin Glassnode 분석
Glassnode Report를 분석한 좋은 글이 있어서 이렇게 올립니다.
원본의 출처는 : https://twitter.com/TXMCtrades/status/1454629376541200386?s=20
TXMC on Twitter
“1/ The #Bitcoin market looks like a coiled spring. Many indicators are telling the same story: * HODLers are uninterested in <$60K * Selling and profit-taking are minimal * Old coin volume, though rising, is still historically low * Accumulation began i
twitter.com
1.
market looks like a coiled spring. Many indicators are telling the same story: * HODLers are uninterested in <$60K * Selling and profit-taking are minimal * Old coin volume, though rising, is still historically low * Accumulation began in May and is ongoing
시장은 감긴 스프링처럼 보입니다. 많은 지표가 같은 이야기를 하고 있습니다. * HODLers는 관심이 없습니다.< $60,000 * 판매 및 차익 실현 최소화 * 오래된 코인 거래량은 증가하고 있지만 여전히 역사적으로 낮은 수준입니다. * 5월부터 적립이 시작되어 진행 중.
2.

When Transfer Volume exceeds 3% of Realized Cap, we typically see a bull run. Transfer volume recently jumped above 3% and has stayed there since September. Utility outpacing network value is a good thing, and the recent increase may suggest demand is picking up.
전송된 볼륨이 Realized Cap의 3%를 초과하면 일반적으로 상승세가 나타납니다. 전송된 볼륨은 최근 3%를 넘어섰고 9월부터 그 자리에 머물렀다. 유틸리티가 네트워크 가치를 능가하는 것은 좋은 일이며 최근 증가는 수요가 증가하고 있음을 시사할 수 있습니다.
* Realized Cap : 사용자가 자산을 획득하는데 지출한 총 금액의 추정치를 Realized Cap 이라고함.
3.

RHODL, the ratio of younger coins to older coins, is screaming that we are still midway through a bull market that began in 2019. It's aligned with the 2013 double pump bull run, matching where price usually breaks the ATH, and has called each previous macro top in history.
최신 코인과 오래된 코인의 비율인 RHODL은 우리가 2019년에 시작된 강세장 중간에 있다고 외치고 있습니다. 그것은 가격이 일반적으로 ATH를 깨는 곳과 일치하는 2013년 더블 펌프 황소 실행과 일치하며 역사상 각각의 이전 매크로 최고점을 불렀습니다.
4.
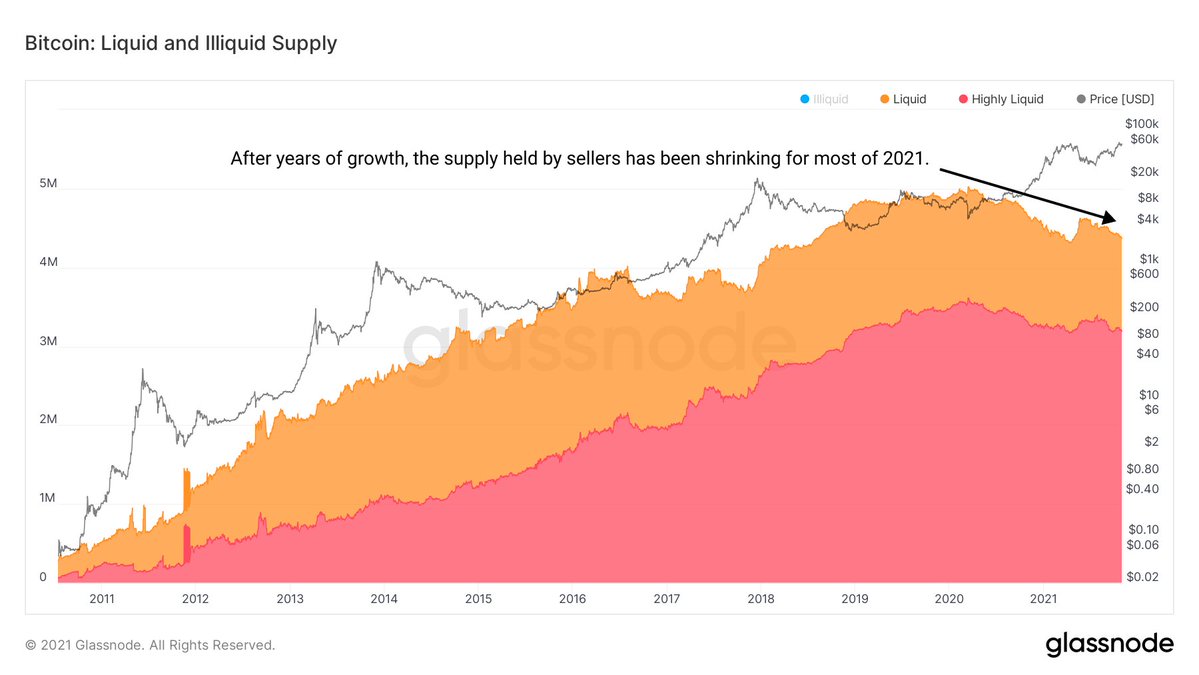
Liquid Supply, the BTC owned by entities with a history of selling, has been in decline since March 2020 after a decade of growth. HODLers are taking more and more supply away from this class of investors. No previous bull run has seen Liquid Supply in steady decline.
판매 이력이 있는 기업이 소유한 BTC인 Liquid Supply는 10년 동안 성장한 후 2020년 3월부터 하락세를 보였습니다. HODLers는 이러한 유형의 투자자로부터 점점 더 많은 공급을 빼앗고 있습니다. 이전의 강세장은 Liquid Supply가 꾸준히 감소한 적이 없습니다.
5.

The MVRV of Long-Term Holders, their ratio of unrealized profit, did not fully reset in 2021 despite selling by this group. They sold less than usual. They remained in high levels of profit (>2.5 MVRV), which has only happened one other time- the 2013 double run. Bullish.
미실현 이익 비율인 장기 보유자의 MVRV는 이 그룹의 매도에도 불구하고 2021년에 완전히 재설정되지 않았습니다. 평소보다 덜 팔았다. 그들은 높은 수준의 이익을 유지했습니다(> 2.5 MVRV), 이는 2013년 더블런에 한 번만 발생했습니다. 낙관적.
6.

Coin Days Destroyed (90d average), a barometer for the volume and age of spent coin volume, is at historical lows. In fact, the October run to the all-time high is the quietest on-chain rally to new prices in the HISTORY of Bitcoin. HODLers aren't interested in these prices.
사용된 코인의 양과 기간에 대한 바로미터인 폐기된 코인 일수(평균 90일)가 역사적 최저치입니다. 실제로 10월 사상 최고치를 경신한 것은 비트코인의 역사에서 새로운 가격에 대한 가장 조용한 온체인 랠리입니다. HODLers는 이 가격에 관심이 없습니다.
7.

The % of supply owned by coins < 3 months is the lowest it has ever been in twelve years. Put another way, coins older than 3 months own more supply than they ever have. The vast majority of daily volume is from the youngest coins. HODLers have not stopped stacking.
코인이 소유한 공급량의 %< 3개월은 12년 만에 최저치다. 다시 말해, 3개월 이상 된 코인은 이전보다 더 많은 공급량을 보유하고 있습니다. 일일 거래량의 대부분은 가장 어린 코인입니다. HODLer는 축적을 멈추지 않았습니다.
8.

SOPR, the profit ratio of spent coins, is still muted considering the current market value and our proximity to new highs. It's showing relative baseline activity, not the spiking profit values we would expect in a distribution event. Yet more evidence of patient HODLers.
사용된 코인의 수익 비율인 SOPR은 현재 시장 가치와 새로운 최고점에 대한 근접성을 고려할 때 여전히 차분한 상황입니다. 이는 분배 이벤트에서 예상되는 급증하는 이익 값이 아니라 상대적인 기준 활동을 보여줍니다. 환자 HODLers의 더 많은 증거.
9.
This thread is not exhaustive. I could add a dozen more looks that corroborate the same bull assessment. The market is always vulnerable to a big enough sell order, but the data tells us that any attempts to tank price will be absorbed in due time. Sat stackers are winning.
이 스레드는 완전한 것이 아닙니다. 동일한 황소 평가를 뒷받침하는 12가지 모양을 더 추가할 수 있습니다. 시장은 항상 충분히 큰 매도 주문에 취약하지만 데이터에 따르면 가격을 낮추려는 모든 시도는 적절한 시기에 흡수될 것입니다. 토 스태커가 이깁니다.
10.
Quiet on-chain activity near all-time highs is okay. Retail doesn't need to be here for price discovery. What price will entice the current HODLers to relinquish their digital corn to new buyers? What narrative will awaken the casual retail machine? November should be fun.
사상 최고치에 가까운 조용한 온체인 활동은 괜찮습니다. 소매점은 가격 검색을 위해 여기에 있을 필요가 없습니다. 현재 HODLers가 디지털 옥수수를 새로운 구매자에게 양도하도록 유도하는 가격은 얼마입니까? 어떤 내러티브가 캐주얼 소매 기계를 깨울 것입니까? 11월은 재미있어야 합니다.
============================================================================
상기 내용은 글래스노드의 주간리포트를 트위터 TXMC가 해석한 내용을 간단히 번역기를 돌리고 약간의 수정을 하여 올렸습니다.
비트코인은 최근 67K의 최고점을 찍고 현재는 조정을 하고 있습니다. 이게 조정의 장인지 하락의 장인지 의견은 차이가 많습니다. 하지만 OnChain Data는 조정으로 보여지고 있습니다.
글래스노드는 Onchain Data를 제공하고 있으며 퀄리티가 가장 좋은 데이터중에 하나입니다. 월구독료가 매우 비싸서 접근하기 쉽지는 않습니다. 하지만 주간 리포트는 열람이 가능하니 하기 링크를 통해서 양질의 정보를 구독하시길 바랍니다.
글래스노드 링크 : Glassnode Insights - Newsletter
Glassnode Insights - Newsletter
Glassnode is your gateway to on-chain data. Through our newsletters, we publish regular contextualised insights and market updates drawn from on-chain market intelligence.
insights.glassnode.com
상기 내용은 어떠한 투자 조언도 아닙니다. 절대 매수 매도 추천이 아닙니다. 개인적인 생각을 기록하기 위한 글입니다.